


The Importance of S-Curve Scheduling in Construction Projects
In construction project management, the S-curve is one of the most essential control tools. It illustrates the relationship between time (schedule) and cumulative progress or cost. Its characteristic “S” shape reflects the typical project pattern: slow at the beginning (mobilization), steep in the middle (peak activity), and gradual at the end (finishing).|
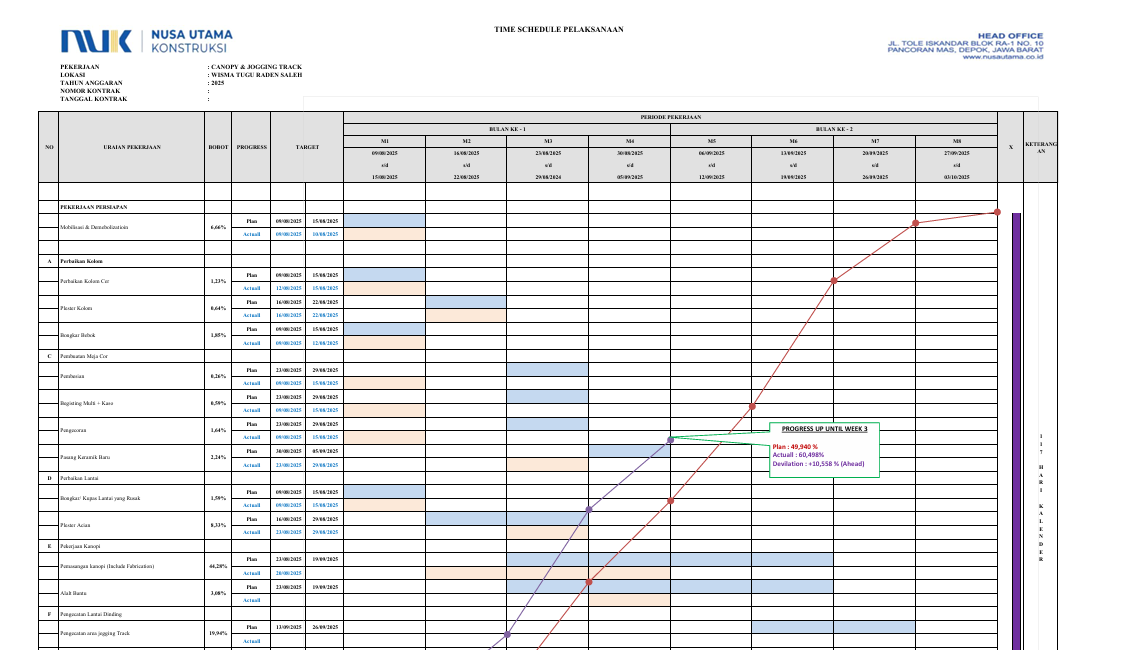
1. Monitoring Progress
The S-curve allows direct comparison between the baseline schedule (planned) and the actual progress (realized). Deviations are quickly identified and serve as the basis for corrective actions.
2. Cost Control
Beyond physical progress, the S-curve is also used to track cash flow and cumulative costs. This helps mitigate the risk of cost overruns.
3. Project Communication
The S-curve simplifies complex data into a clear visual format. The graph is easily understood by stakeholders including owners, consultants, and contractors.
4. Forecasting and Deviation Analysis
Trends in the S-curve can be used to predict delays, calculate float, and analyze the need for work acceleration.
5. Performance Evaluation
The S-curve serves as an important document in evaluating project performance, both as part of routine reporting and as a reference for future projects.
Conclusion
The S-curve is more than just a chart—it is a strategic instrument to ensure proper project control. With the S-curve, the relationship between time, cost, and physical progress can be monitored effectively.